Announcing nationalparkscolors - Color palettes inspired by America’s National Parks
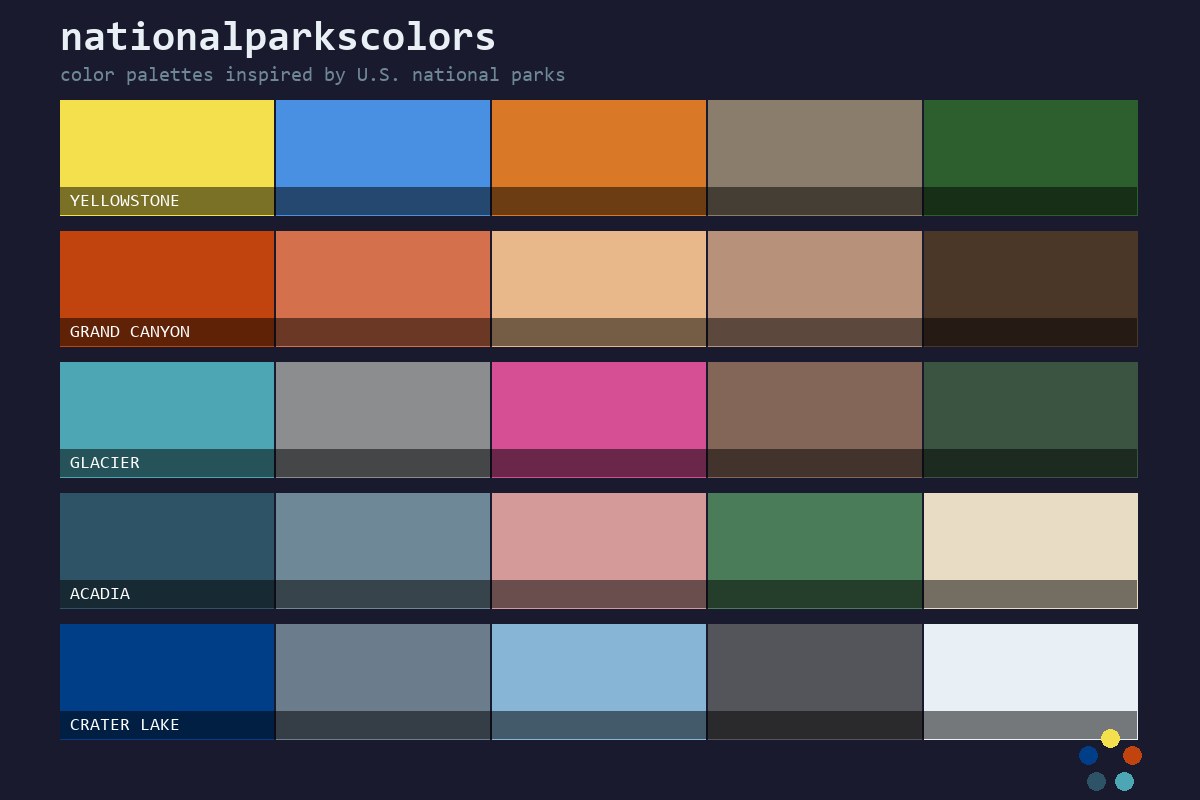
Introducing nationalparkscolors, an R package with 20 color palettes inspired by the landscapes, geology, and ecosystems of iconic US National Parks.
Introducing nationalparkscolors, an R package with 20 color palettes inspired by the landscapes, geology, and ecosystems of iconic US National Parks.
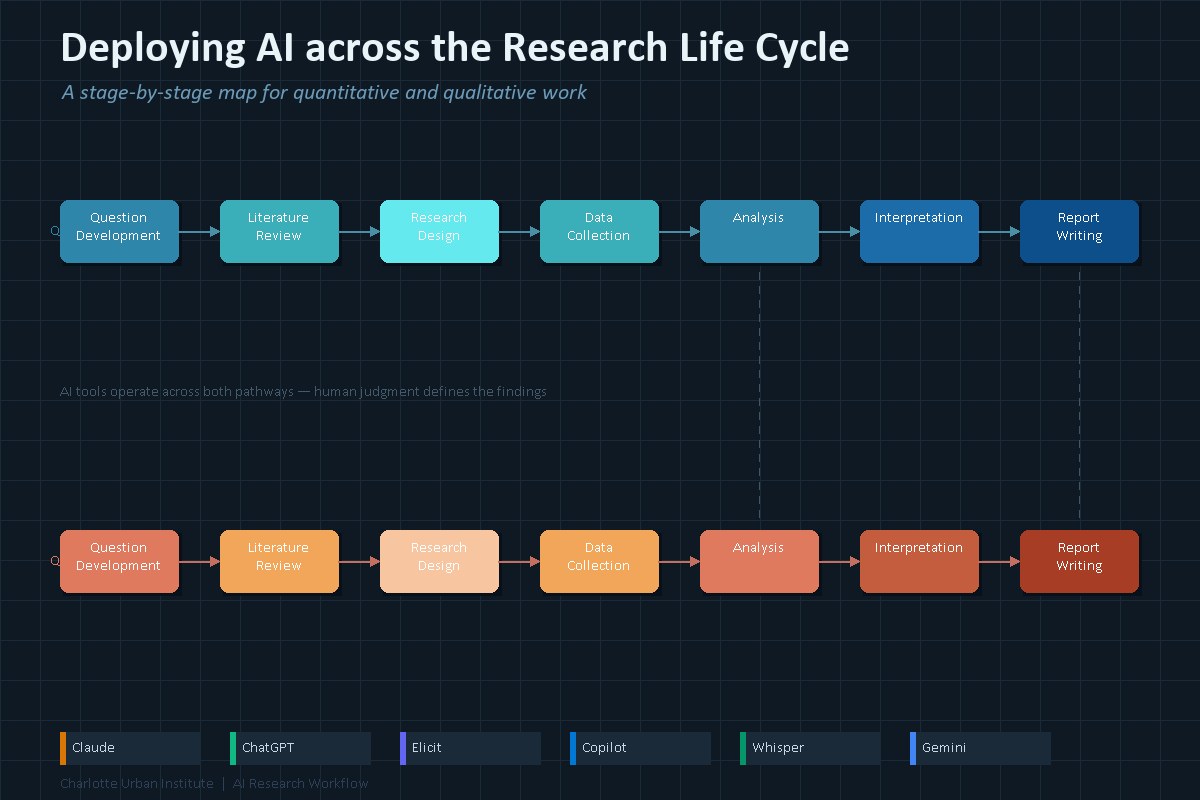
A practical map of where AI tools can and cannot help across the full research life cycle — from question development to report writing — for both quantitative and qualitative work.

Reflections on a year of using generative AI tools in community research — what works, what keeps me up at night about data governance, and the questions we need to answer as an institute before we go further.
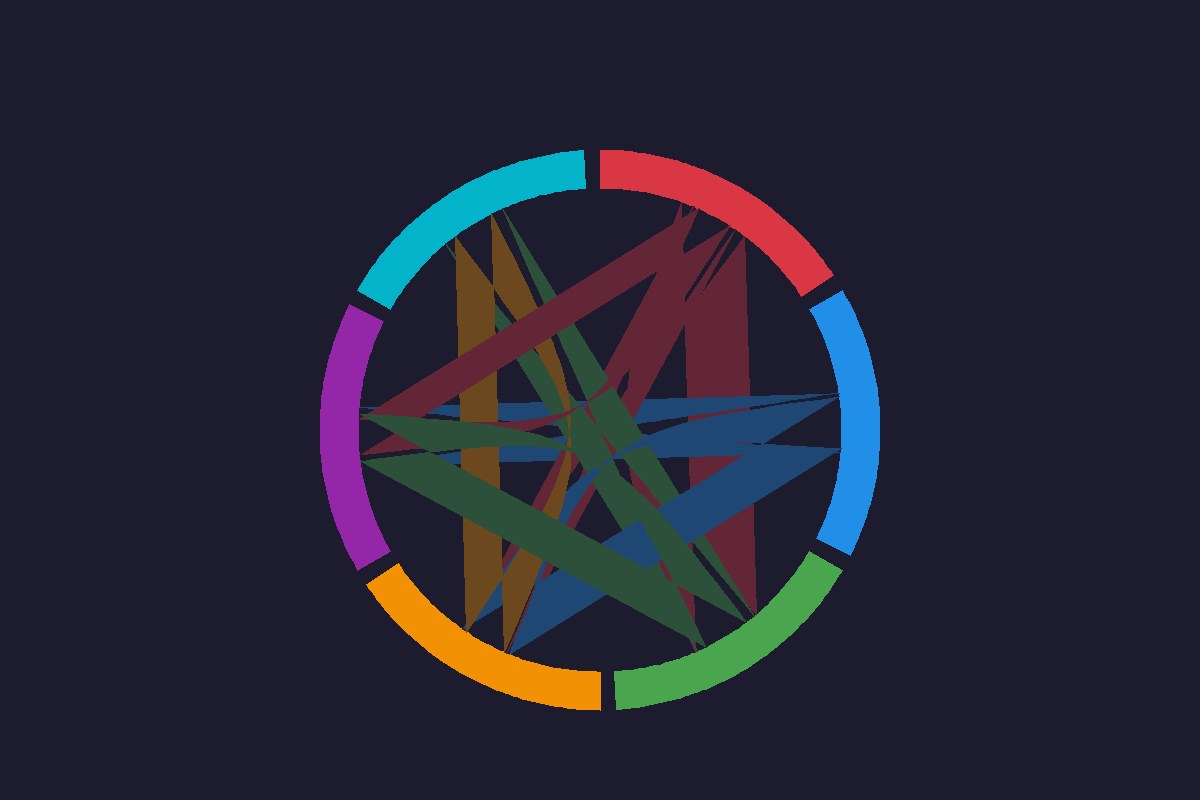
Chord diagrams are one of the most effective ways to show pairwise relationships between entities. This post covers the theory, code-based approaches in R, Python, and JavaScript, and how to build them quickly using Flourish — illustrated with a real example from the Charlotte Regional Data Trust.
Why bilingual fluency in R and Python is becoming essential for community research teams

After years of defaulting to ArcGIS, a real project finally pushed me to give QGIS a serious try and I never went back. Here is what changed, what QGIS does better, and how R has quietly taken on a meaningful share of that workload too.
Bayesian Improved Surname Geocoding (BISG) is a probabilistic method that estimates racial and ethnic group membership using last names and residential geography — a practical tool for working with administrative data that lacks race and ethnicity fields.

The American Community Survey Public Use Microdata Sample (PUMS) gives you individual-level Census records for custom cross-tabulations and analysis. This tutorial walks through using the tidycensus package to pull and analyze PUMS data for Mecklenburg County, NC.

Introducing elements of data pipelines used in community research at the Urban Institute
reconciling our work with the strategic goals and movements at the institute